
Lerback & Hanson claim that women have less opportunities to be reviewers than men and are therefore disadvantaged in their academic career (1). They analyze the proportion of women among authors and reviewers who have contributed to journals of the American Geophysical Union. Lerback & Hanson’s basic idea is that “the gender ratio of reviewers should be similar to that of published authors of similar age”. They claim that their analyses show that this is not the case, and that women are not invited as often to review as they should. The analyses are, however, flawed.
Lerback & Hanson show in Panel D that 20% of reviewers were female whereas 27% female reviewers were expected. We argue that this comparison is invalid because of confounding by age. Panel C claims to compare the proportion of invited female reviewers with the expected proportion of females. It is, however, not the proportion of women among distinct invited reviewers but the proportion of invitations sent to females that is compared to the distinct authors. The analysis unit is not the same and the comparison therefore invalid. Using the data posted on Figshare, we compared the distinct invitee population to the distinct author population and could demonstrate similar proportions of females among the invitees as among authors. Finally, most of the statistical tests in the paper and the Supplementary material are invalid. The tests comparing reviewers and authors assume independent observations, but the data points are not independent as many individuals are in both groups.
Actual reviewers vs published authors
Lerback & Hanson’s basic argument is that the population of authors is representative for those who are eligible to be reviewers, or in their own words “the gender ratio of reviewers should be similar to that of published authors of similar age”. The age plays a role, because the proportion of women in geophysical sciences has increased substantially over the last decades. The gender ratio of 50 year old reviewers is obviously not expected to be the same as the gender ratio of 30 year old authors, see Figure 1.
Figure 1. Number of “Distinct published first authors”, “Distinct all published authors”, and “Distinct reviewers” by age groups
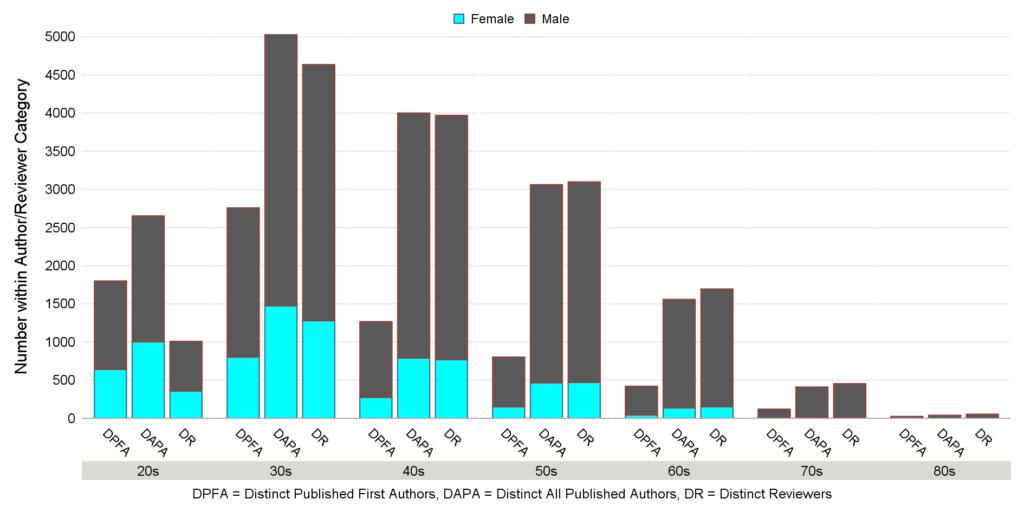
Unfortunately, Lerback & Hanson do not take any age effects into account when calculating the expected proportion of female reviewers in the total population. Their expectation of the total population of 27% is a simple average over the population of female first authors (the average of the Supplementary Table 8’s “Distinct published first authors” row is 26.6% females). This average is in fact weighed with the proportion of authors in the population that fall into each age group. Since younger authors are obviously less often invited to be reviewers than older authors, and there are many young female authors, this yields a biased estimate of the expected – the young weigh too much.
Consider Table 1 of the raw data from Table 8 of the Supplementary material. In the All line we recognize the 27% and 20% females across all ages from Panel D. This 7% point difference is greater than the difference in any of the age groups (which are between 0 and 5% points). If we just compare 27% with 20% there is confounding by age.
Table 1. Proportion of reviewers and distinct first authors
| Age group | Proportion of females among Distinct reviewers | Proportion of females among Distinct first authors |
| 20’s | 35.2% | 35.5% |
| 30’s | 27.6% | 29.1% |
| 40’s | 19.4% | 21.7% |
| 50’s | 15.2% | 18.6% |
| 60’s | 8.9% | 10.0% |
| 70’s | 3.5% | 4.1% |
| 80’s | 7.4% | 12.0% |
| All | 20.4% | 26.6% |
The discrepancy between the overall gender distribution and the age-specific distribution is an example of Simpson’s Paradox and akin to one of the best-known examples of the paradox described in a study of gender bias of admissions to UC Berkeley1. In the Berkeley study, admission gender rates were equal within departments, but unequal in total. In this study, the gender rates of reviewers are compared to author rates.
Some kind of stratified analysis is obviously needed. A simple method to make a comparison controlled for age is to calculate a weighted average of the female proportions. Using the age distribution of Distinct reviewers as weights, the expected female proportion based on Distinct first authors is 22.4%, considerably less than the 27% used by Lerback & Hanson.
Invited reviewers vs published authors
Lack of age standardization is, however,
not the only problem in the analysis. Lerback & Hanson’s main conclusion is
that too few women are invited to review. But the above numbers are for actual reviewers, not invited reviewers. The gender
distribution of invited reviewers is
nowhere to be found in the Comment. We have tabulated it from the data posted
on Figshare, see Table 2. The observed overall female proportion among invited
reviewers is 20.9%, which is higher than the female proportion among actual
reviewers used by Lerback & Hanson (20%). This is consistent with the
female decline rate of invitations being higher than the male decline rate
(Panel E).
Table 2. Female proportion among Distinct invited reviewers
| Age group | Proportion of females |
| 20’s | 35.6% |
| 30’s | 29.6% |
| 40’s | 20.3% |
| 50’s | 15.9% |
| 60’s | 9.5% |
| 70’s | 3.2% |
| 80’s | 4.4% |
| All | 20.9% |
Obviously, it is the observed female proportion among the invitees that must be compared to the expected. As a consequence, the weights used to calculate the expected must be the age distribution of the invitees. Using these weights and the Distinct first author population, we get an expected of 21.9%, so now the original 7% point difference has shrunk to 1.0% point.
A question arises, however, about the relevant author population. Using the “Distinct published first authors” population excludes researchers who have published as co-authors but not as first authors during the 4-year time period under study. These are often senior researchers who are particularly eligible as reviewers – whether men or women.
Moreover, the “Distinct reviewer” population comprises 14,919 individuals (Supplementary Table 8), whereas the “Distinct published first authors” population has only 7,196 individuals. It is counterintuitive to use the smaller population as representative of the larger one.
The more relevant author population is therefore the Distinct all authors population. The weighted average based on Distinct all authors is 20.5% (the calculation is shown in Table 3), which is the expected proportion of females to compare with the observed of 20.9% among the invited reviewers. In this final, relevant comparison there is an advantage to the women of 0.4% point.
Table 3. Calculation of the relevant weighted average
| Age group | Proportion of females among Distinct all authors | Age distribution of invited reviewers | Weighted contribution to expected proportion of females based on Distinct all authors |
| 20’s | 37.7% | 6.3% | 2.4% |
| 30’s | 29.1% | 28.7% | 8.3% |
| 40’s | 19.7% | 26.6% | 5.3% |
| 50’s | 15.2% | 21.9% | 3.3% |
| 60’s | 8.7% | 12.2% | 1.1% |
| 70’s | 2.9% | 3.8% | 0.1% |
| 80’s | 7.5% | 0.5% | 0.0% |
| Total | . | . | 20.5% |
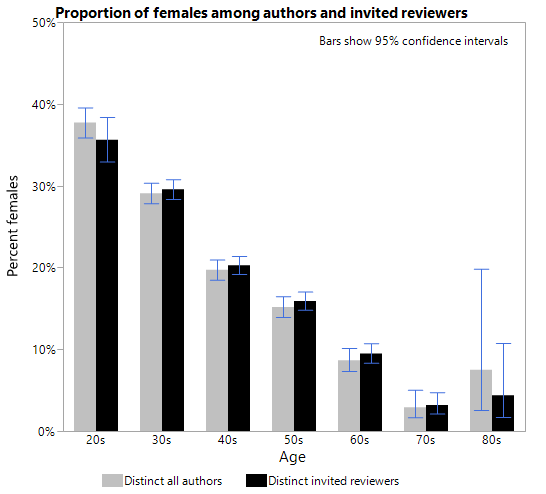
The Figure below brings out the same point. The proportion of females among invited reviewers and authors are very similar in each age group, and except in the first group the women are even invited slightly more than the men.
The above weighted averages are controlled for age only to the degree that all age effects are captured by the age groups. This is not likely to be the case since there is obviously strong confounding by age and the age groups are wide. There could be confounding by age within each age group. An analysis with narrower age bands is likely to yield lower estimates of the expected than those above (i.e. a greater advantage to the women).
Other observations
Statistical testing
The populations of authors and reviewers are not distinct. A scientist can obviously be both author and reviewer and be included in both populations. It is not possible to identify the individual who are identical in the datasets on Figshare. It is, however, clear that the chi-square tests presented by Lerback & Hanson in Supplementary Tables 9 and 10 violate the basic assumption of independent observations. The observations between groups must be independent, which means the groups are made up of different people. If people appear twice in different groups, it can skew the results.
Invited reviewers vs issued invitations
Lerback & Hanson’s main point is that editors invite too few women to be reviewers. Panel C seems to support this claim. This is however not the case. The bars in Panel C show invitations, not invitees – tabulating the data about suggestions for reviewers posted on Figshare yields percentages that correspond to those that can be read from Panel C (see Table 4). Thus, it is not the proportion of women among distinct invited reviewers but the proportion of invitations sent to females that is compared to the distinct authors. This comparison is misleading. We have presented the proper comparison above.
Table 4. All invitations to review. By editor gender
| Suggested Reviewer: Gender | |||||
| Female | Male | ||||
| Editor: Gender | Suggested Reviewer: Age Cohort at Activity | N | Row % | N | Row % |
| Female | 20’s | 137 | 32% | 286 | 68% |
| 30’s | 1185 | 30% | 2713 | 70% | |
| 40’s | 1036 | 22% | 3603 | 78% | |
| 50’s | 740 | 18% | 3268 | 82% | |
| 60’s | 241 | 12% | 1828 | 88% | |
| 70’s | 33 | 7% | 471 | 93% | |
| 80’s | 10 | 14% | 62 | 86% | |
| All | 3382 | 22% | 12231 | 78% | |
| Male | 20’s | 871 | 31% | 1921 | 69% |
| 30’s | 6304 | 26% | 18271 | 74% | |
| 40’s | 5045 | 18% | 22552 | 82% | |
| 50’s | 3137 | 13% | 20607 | 87% | |
| 60’s | 1172 | 9% | 12106 | 91% | |
| 70’s | 116 | 3% | 4132 | 97% | |
| 80’s | 53 | 11% | 420 | 89% | |
| All | 16698 | 17% | 80009 | 83% |
The comparison in Panel B is flawed in the same way, the bars are not distinct female reviewers suggested but suggestions for female reviewers, and the red lines are the distinct authors.
Panel E cannot be reproduced based on the numbers in Supplementary Table 25, and it is not clear how it has been made and what it shows. Supplementary Table 25 clearly analyses invitations, whereas the text in Panel E implies that the analysis unit is person. It is not clear how a declining person is defined in Panel E. A declining person may be defined in several ways, for example as one who declines all invitation, or as one who declines at least one.
In conclusion, the proper data analysis shows that women’s chance of being invited to review is as expected, not that too few are invited. The lower representation of women among researchers in STEM should not be sought in bias against them as authors or reviewers.
26-Sep-19
Torsten Skov, MD, PhD
Kim Mark
Knudsen, MSc, PhD
Reference List
(1) Lerback J, Hanson B. Journals invite too few women to referee. Nature 541[7638], 455-457. 25-1-2017.
(2) Bickel PJ, Hammel EA, Connell JW. Sex Bias in Graduate Admissions: Data from Berkeley. Science 187[4175], 398. 7-2-1975.